
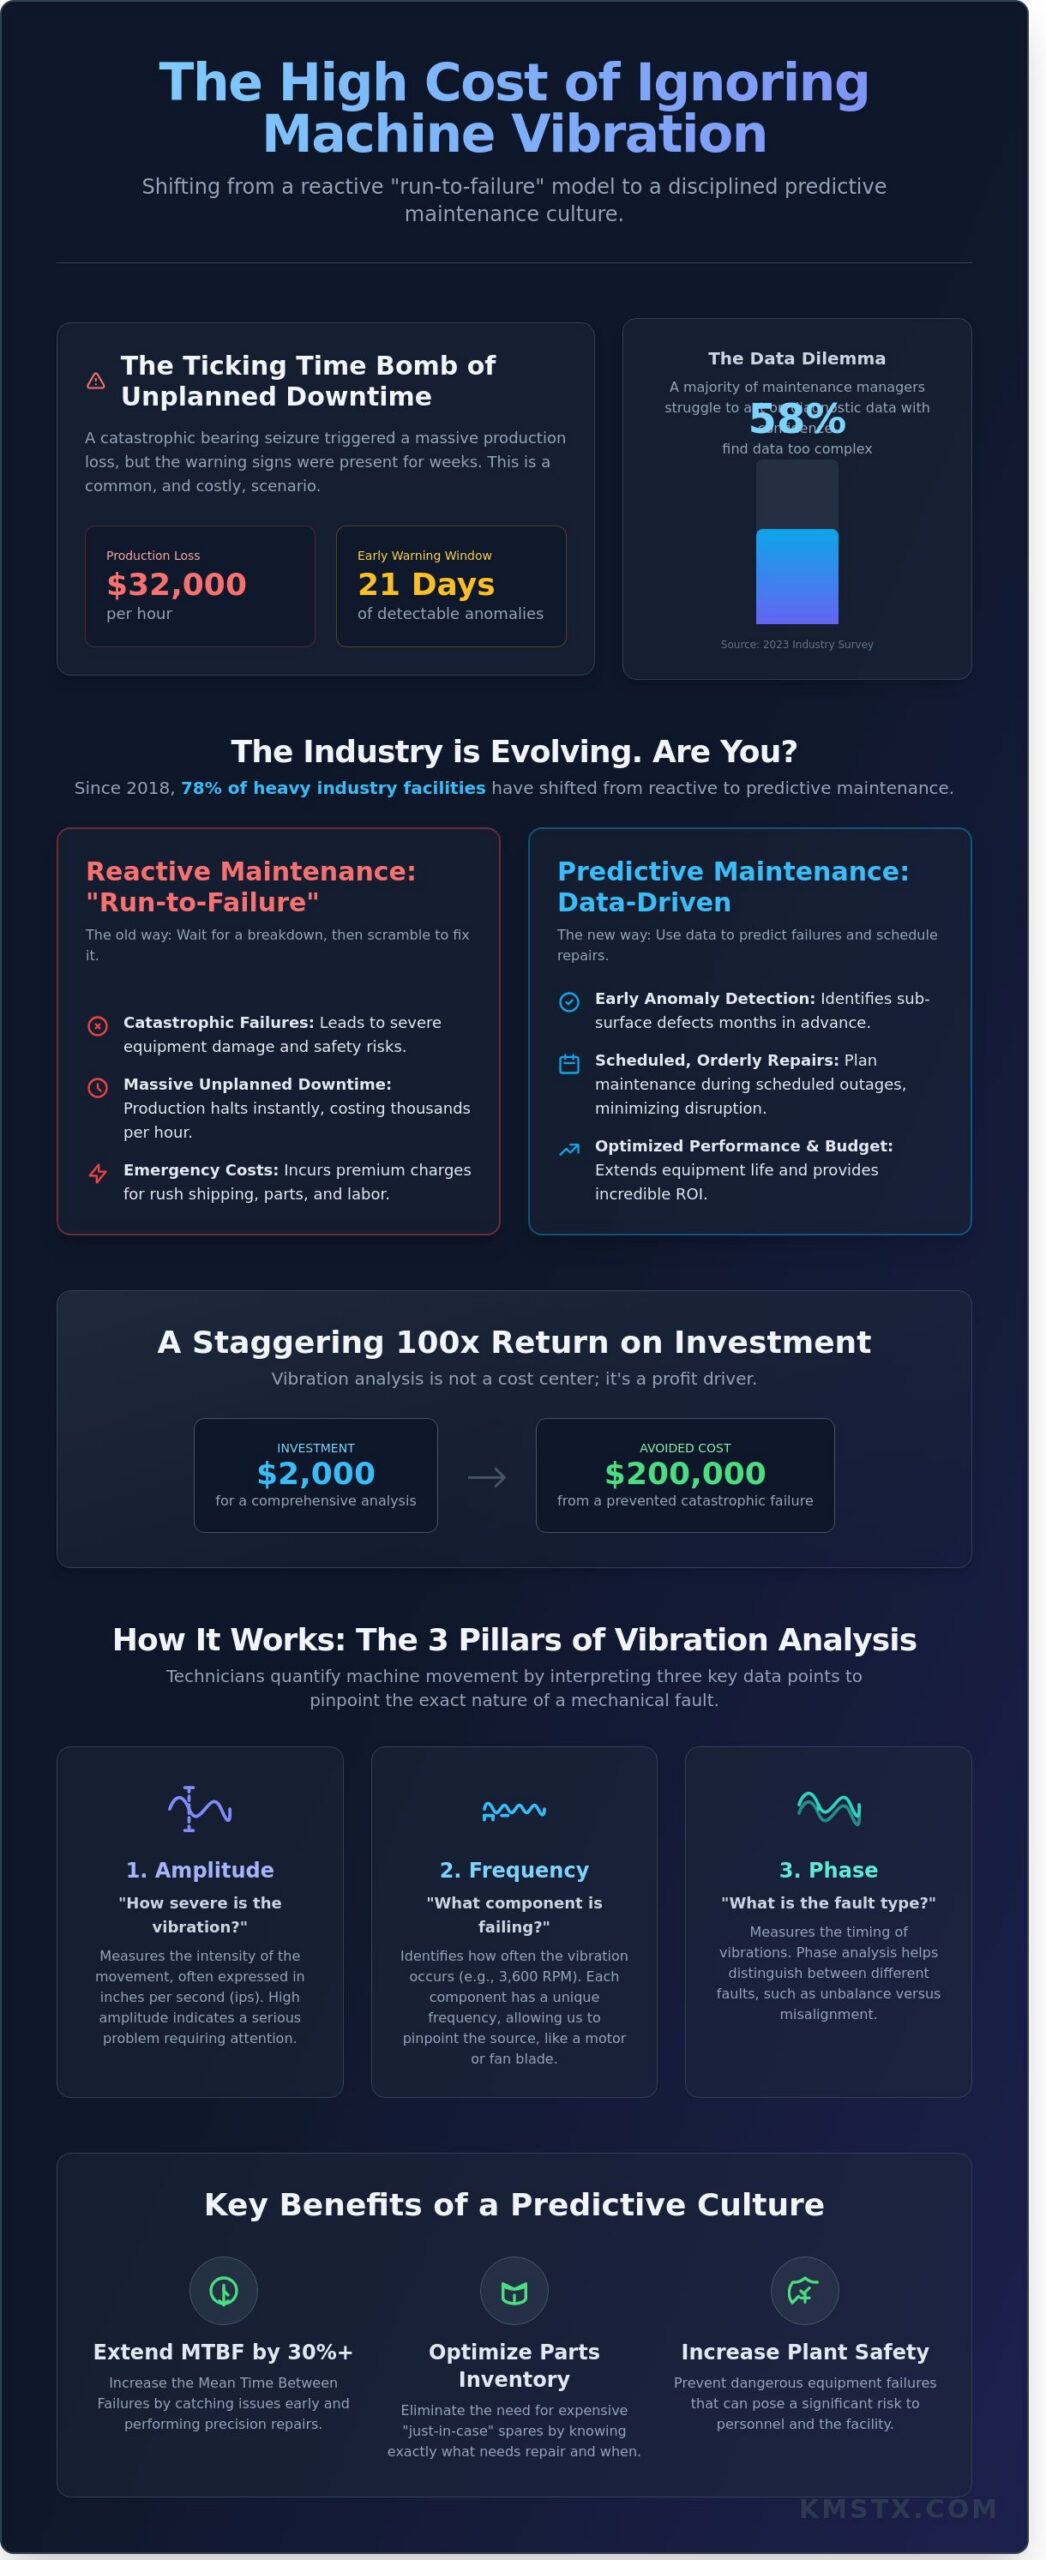
Last Tuesday at 2:45 AM, a primary feed pump at a Midwestern processing plant suffered a catastrophic bearing seizure, instantly triggering a $32,000 per hour production loss. The failure wasn’t a freak accident; the machine had been shouting for help through microscopic frequency changes for nearly 21 days. By integrating industrial equipment vibration analysis into your daily routine, you can identify these mechanical faults long before they result in a pile of broken parts. Most of us agree that the high cost of unplanned downtime is the biggest threat to the quarterly budget, yet a 2023 industry survey showed that 58% of maintenance managers still find diagnostic data too complex to act on with confidence.
It’s a common fear that you’ll miss a subtle warning sign hidden in a noisy spectrum, leading to a crash that could’ve been avoided. This article provides a clear framework for identifying the most common mechanical faults and explains how to move your facility from a reactive scramble to a disciplined predictive maintenance model. You’ll learn how to interpret the data effectively and why it’s vital to find a technical partner who can handle both the sophisticated diagnosis and the actual mechanical repair.
Key Takeaways
- Transition from a reactive “run-to-failure” approach to a predictive maintenance culture that identifies mechanical anomalies before they cause expensive, unplanned downtime.
- Understand the three pillars of industrial equipment vibration analysis-amplitude, frequency, and phase-to effectively translate sensor data into a clear picture of machine health.
- Learn how to pinpoint the specific frequency signatures of unbalance and misalignment, allowing you to address the root cause of vibration in heavy rotating machinery.
- Discover how to prioritize your facility’s most critical assets and implement a consistent, route-based monitoring program that ensures long-term reliability.
- See why integrating precision diagnostics with expert machine shop repair is the key to restoring critical equipment to its tightest mechanical tolerances.
Understanding Industrial Equipment Vibration Analysis
Industrial equipment vibration analysis isn’t just about feeling a shake in the floorboards. It’s a precise scientific method used to monitor noise and movement frequencies to detect internal mechanical anomalies. By interpreting these frequency signatures, technicians can identify internal wear that hasn’t reached the surface yet. To understand the physics behind these oscillations, you can explore The Science of Vibration for a detailed look at how waves behave in solid structures. This diagnostic approach allows us to see through the steel casing and understand the health of the rotating components inside.
Most plants operated on a “run-to-failure” model for decades. They’d push a pump until the bearings seized or a seal blew. Since 2018, roughly 78% of heavy industry facilities have shifted toward a predictive, data-driven maintenance culture. Rotating machinery like high-speed centrifuges, industrial pumps, and multi-stage gearboxes are the best candidates for this approach. These machines generate distinct, repeatable frequency patterns that change in predictable ways when a fault develops. Capturing this data early is the difference between a scheduled fix and a midnight emergency call.
To better understand how these concepts work in a real-world shop environment, watch this helpful video:
Let’s look at the financial reality of this technology. A typical industrial equipment vibration analysis route might cost a facility $2,000 for a comprehensive survey. If that analysis catches a slight misalignment in a primary feed pump, it prevents a $200,000 catastrophic failure. That’s a 100x return on investment. It’s not just about the repair cost; it’s about the 12 to 24 hours of unplanned downtime you avoid. When a machine fails unexpectedly, you’re paying for parts, rush shipping, emergency labor, and lost production capacity all at once.
The Core Objectives of Vibration Monitoring
The primary goal is the early detection of sub-surface defects that visual inspections simply can’t catch. By identifying a pitted bearing race six months before it fails, you can extend the Mean Time Between Failures (MTBF) by 30% or more. This data also helps optimize your spare parts inventory. You don’t need to keep $50,000 worth of backup gearboxes on the shelf if you know exactly which unit is healthy and which one is likely to need service next quarter.
Vibration Analysis vs. Traditional Maintenance
Listening for problems with a screwdriver against your ear doesn’t work for a 3,600 RPM motor. It’s too fast and the ambient noise is too high. While thermography finds heat and oil analysis finds contaminants, industrial equipment vibration analysis tells you the mechanical “why” behind the movement. We use ISO 10816 standards to establish a baseline for “healthy” vibration levels. If a machine’s velocity exceeds these established zones, we know we’ve got a problem that requires immediate attention before it escalates into a safety hazard.
The Science of Detection: How Vibration Monitoring Works
Effective industrial equipment vibration analysis isn’t just about feeling a machine shake. It’s about quantifying movement through three specific pillars: amplitude, frequency, and phase. Amplitude measures the severity of the vibration, often expressed in inches per second (ips) or G-force units. Frequency identifies how often the vibration occurs, which helps us pin the problem to a specific component like a motor or a fan blade. Phase tells us the timing of that vibration relative to a fixed point; it’s the difference between a machine that’s slightly out of balance and one that has a bent shaft.
The process starts with sensors. Most technicians rely on piezoelectric accelerometers. These devices contain a crystal that generates an electrical charge when it’s squeezed or moved by mechanical force. This raw signal looks like a chaotic, squiggly line on a screen. To make sense of it, we use the Fast Fourier Transform (FFT). This mathematical algorithm breaks down that complex noise into a readable spectrum. It’s like taking a finished soup and perfectly separating every ingredient back into individual bowls. By isolating these frequencies, we can see exactly which part is complaining before it actually breaks.
Data doesn’t mean much without context. You have to establish a baseline for every asset. A healthy 50 HP motor sounds different than a healthy 500 HP compressor. We typically gather data over a 30-day period to define “normal” operating conditions. According to documented findings in NASA’s Predictive Maintenance protocols, establishing these benchmarks is the only way to catch a 15% increase in vibration before it leads to a catastrophic bearing failure. If you don’t know what your machine sounds like when it’s happy, you won’t recognize the early signs of distress.
Sensors and Data Acquisition Tools
Piezoelectric accelerometers are the industry standard because they handle high-frequency detection up to 10kHz with ease. However, they aren’t perfect for every job. For sleeve-bearing machines, we use proximity probes. These measure the actual displacement of the shaft within the bearing housing rather than the vibration of the casing. Choosing between handheld and permanent sensors depends on the risk. We use route-based handheld collection for 70% of general plant equipment, but critical assets require 24/7 permanent monitoring to prevent a single minute of unplanned downtime. For those looking to upgrade their fleet oversight, exploring precision monitoring solutions can bridge the gap between manual checks and automated alerts.
These diagnostic principles extend beyond stationary plant equipment to mobile fleets as well. For assets like forklifts, cranes, and other heavy movers, specialized multi-brand diagnostic systems are crucial for effective fleet maintenance. If you manage such equipment, you can learn more about Jaltest MHE (Material Handling Equipment) Kit to see how these advanced tools are applied.
Interpreting the Vibration Spectrum
Reading a machine’s “signature” requires looking for peaks, valleys, and harmonics. A peak at the 1x running speed usually suggests unbalance. If we see peaks at 2x or 3x the running speed, we’re likely looking at misalignment or a loose mounting bolt. Different components show up at specific intervals; for instance, gear mesh frequencies appear much higher on the spectrum than simple motor hum. While FFT is great for steady-state issues, we also use time-waveform analysis. This captures short, sharp impacts that the FFT might smooth over, such as a single cracked tooth on a gear or a pit in a bearing race. Identifying these patterns early reduces repair costs by an average of 22% compared to reactive maintenance.
Diagnostic Indicators: What Your Machinery is Trying to Tell You
Experienced millwrights know that a machine doesn’t just fail; it signals its distress long before a catastrophic breakdown occurs. Through industrial equipment vibration analysis, we can translate these mechanical signals into actionable data. Unbalance remains the primary culprit in roughly 40% of rotating equipment failures. In heavy rotors like those found in industrial centrifuges, even a few grams of weight distribution error can generate thousands of pounds of centrifugal force at 3,600 RPM. This usually manifests as a dominant 1X frequency peak in the vibration spectrum.
Misalignment presents a different signature. When shafts aren’t perfectly coupled, you’ll often see distinct 1X and 2X peaks. Parallel offsets typically drive the 2X frequency, while angular misalignment shows up more strongly at the 1X radial and axial positions. Understanding the fundamentals of vibration analysis allows technicians to differentiate these peaks from simple unbalance, preventing unnecessary rotor balancing when a simple laser alignment is what’s actually needed. This distinction saves crews from hours of wasted “trial and error” weights.
- Bearing Wear: You’ll hear the “clicking” of a pitted race or a flat ball in the high-frequency range. This ultrasonic noise appears months before the bearing creates enough friction to generate detectable heat. By monitoring the inner and outer race frequencies, we can track a defect’s progression from a microscopic pit to a 2mm spall.
- Mechanical Looseness: This is often identified by a “floor” of raised noise in the spectrum or significant phase shifts between the machine and its base. It’s usually caused by structural fatigue or mounting bolts that have backed off under constant load. If the phase is unstable, it’s a clear sign that the machine isn’t tied down properly.
Centrifuge-Specific Vibration Challenges
Decanter and disc-stack centrifuges operate under extreme conditions, often exceeding 3,000 Gs. In these environments, even minor “slop” in the rotating assembly or uneven cake buildup creates transient vibration spikes that can trip a vibration switch in seconds. Precision is non-negotiable here. High-speed separation requires dynamic balancing to ensure the center of mass aligns perfectly with the geometric axis. Without it, the resulting force will eventually destroy the main bearings and the spindle assembly, leading to six-figure repair bills.
Gearbox and Transmission Faults
Gearboxes present a complex “forest” of frequencies where identifying specific faults requires a keen eye. We look specifically for the gear mesh frequency (GMF) and the “hunting tooth” frequency to find flaws. A cracked tooth produces a sharp, repetitive impact pulse that shows up as sidebands around the GMF, while general surface pitting creates a broader increase in the noise floor. In 65% of gearbox failures, oil contamination is the root cause. Particulates in the lubricant act as an abrasive, accelerating the vibration-wear cycle and leading to premature tooth profile degradation. Effective industrial equipment vibration analysis identifies these mesh issues before the teeth begin to shed metal into the sump, preventing a total transmission lockup.
From Data to Action: Implementing a Predictive Maintenance Strategy
Criticality rankings dictate the frequency of your industrial equipment vibration analysis. Most reliability engineers utilize a 1 to 5 scale to prioritize assets. A Tier 1 asset, such as a 1,500 HP primary compressor, represents a single point of failure that could cost $15,000 per hour in lost revenue. These machines require monthly or even continuous monitoring. Conversely, a Tier 5 backup exhaust fan might only need a semi-annual check. By focusing resources on the 20% of equipment that drives 80% of your production value, you maximize the impact of your maintenance budget.
Training your team to interpret data is just as vital as the hardware itself. Operators should know the difference between a minor 0.05 inches per second (ips) deviation caused by process fluctuations and a “red zone” alarm. When a machine hits a 0.35 ips threshold, it’s no longer a “watch and wait” situation. You’ve got to have clear protocols that empower the reliability team to pull a machine from service before a catastrophic failure occurs. This decisive action is what separates a world-class facility from one that’s constantly fighting fires.
Establishing Alarm Limits and Baselines
Relying solely on OEM vibration specs is a common mistake that leads to missed failures. Original equipment manufacturers provide generalized tolerances that don’t account for your specific foundation stiffness, grout condition, or piping strain. You should use the first 12 months of stable operation data to build custom baselines for every unique machine. This empirical data allows you to set narrow, accurate alarm bands. Proper calibration reduces alarm fatigue by 35%, ensuring that when a notification hits an engineer’s desk, it represents a genuine mechanical issue rather than a ghost in the system.
Integrating Analysis into the Repair Workflow
Effective maintenance doesn’t end when the vibration tech spots a fault; it integrates directly into the teardown process. A pre-repair spectral scan provides a roadmap for the millwrights, identifying whether they’re looking for a bent shaft, a loose foot, or an outer-race bearing defect. This precision saves an average of 4.5 hours per repair by eliminating guesswork during the disassembly phase.
Post-repair verification serves as your final quality gate. Before a machine is officially returned to the production schedule, a follow-up analysis must confirm it meets your “as-left” precision standards, typically under 0.07 ips for high-speed rotors. Documenting the “as-found” versus “as-left” condition is essential for warranty claims and insurance audits. This paper trail proves that the repair was successful and that the asset is starting its new lifecycle in peak condition.
The KMS Edge: Precision Diagnostics Meets Heavy-Duty Repair
Software-only diagnostic firms often provide a report that identifies a failing bearing, but they rarely explain why a housing is bored off-center or why a rotor has developed a thermal bow. Kelsey Machine Services bridges this gap. We’ve spent 40 years doing more than just reading sensors; we fix the underlying iron. A report is just a piece of paper, but a balanced rotor is a tangible result. Since our founding in 1984, our focus has remained on restoring rotating equipment to tolerances that often exceed original OEM specifications. We don’t just hand you data and walk away.
Our “Full Circle” methodology is a proven workflow that eliminates guesswork from your maintenance schedule. It begins with industrial equipment vibration analysis to capture the machine’s signature under load. Once we identify the anomaly, our team moves into a strategic teardown. We don’t just swap parts; we inspect wear patterns that tell the story of the machine’s life. Our machinists then restore fits and finishes, followed by dynamic balancing. We finish every job with a verification phase to ensure the equipment operates within specified velocity and displacement limits before it returns to your floor.
Downtime in a petrochemical or manufacturing plant can cost upwards of $15,000 every hour the line is cold. Our 24/7 emergency response team understands this pressure. We combine on-site analysis with rapid shop-floor restoration to minimize your Mean Time To Repair (MTTR). If a critical pump fails on a Saturday, we’re on-site by Saturday afternoon and often have the rotor in our Stafford shop by Sunday morning. This integration of field diagnostics and heavy machining ensures you aren’t waiting on two different companies to talk to each other while your production sits idle.
- Analyze: We use high-fidelity sensors to pinpoint the exact frequency of the fault.
- Teardown: Our experts disassemble the unit to find the physical evidence of the vibration.
- Machine: We restore surfaces, bores, and shafts to precision tolerances in-house.
- Balance: We eliminate centrifugal forces that cause premature component failure.
- Verify: We provide a final vibration sign-off to guarantee the repair’s integrity.
Proprietary Balancing and Machining Capabilities
Precision is non-negotiable in high-speed applications. Our in-house dynamic balancing processes address the root cause of 90% of vibration issues we encounter in the field. We often see components where the original manufacturer no longer provides support or parts. In these cases, our machinists create custom components from scratch to keep your line running. Every centrifuge repair we handle undergoes a rigorous vibration sign-off before it leaves our floor. We verify that the equipment meets ISO 1940-1 standards, ensuring long-term reliability and peace of mind for your operations team.
Ready for a Diagnostic Health Check?
Your facility’s uptime depends on proactive maintenance rather than reactive panic. We provide field service consultations across Texas and the Gulf Coast, bringing our mobile industrial equipment vibration analysis tools directly to your site. While our roots are in the Houston area, our Stafford and Magnolia facilities support national clients who ship critical assets to us for specialized repair and balancing. Don’t wait for a catastrophic failure to address your noise and heat issues. Request a comprehensive vibration analysis and equipment assessment today.
Stabilizing Your Operations Through Predictive Insight
Effective maintenance doesn’t start when a machine stops; it starts with the data that explains why it’s vibrating in the first place. By integrating industrial equipment vibration analysis into your routine operations, you move from reactive repairs to a controlled, predictive model. This shift eliminates the guesswork that often leads to catastrophic bearing failures or bent shafts. We’ve spent over 40 years refining these diagnostics for the most demanding Gulf Coast facilities. Our technicians combine this analytical data with practical shop floor capabilities, including in-house dynamic balancing and precision CNC machining. This ensures your rotating equipment returns to service within OEM tolerances every time. We provide 24/7 emergency field service across the region because mechanical issues don’t follow a standard shift schedule. Taking control of your asset health today prevents the high costs of emergency outages tomorrow.
Schedule a Precision Vibration Analysis for Your Critical Assets
Your machinery is the backbone of your facility, and we’re ready to help you keep it running smoothly for the long haul.
Frequently Asked Questions
How often should I perform vibration analysis on my industrial equipment?
You should schedule vibration analysis based on the criticality of the asset, typically ranging from monthly for high-stakes machinery to quarterly for standard units. For a 1,500 RPM centrifugal pump, a 90 day interval often catches bearing wear before a catastrophic failure occurs. If you’re running 24/7 operations, monthly checks provide the 85% reliability rate needed to prevent unplanned downtime across your entire facility.
Can vibration analysis detect issues in low-speed machinery?
Vibration analysis effectively detects faults in machinery running below 100 RPM if you use the right sensors. Standard sensors often miss the subtle signals of a slow-turning gearbox. You’ll need high-sensitivity accelerometers, usually rated at 500 mV/g, to pick up the low-frequency energy generated by a 15 RPM kiln drive. Without this specialized hardware, the signal-to-noise ratio is too low for accurate diagnostics.
What is the difference between an accelerometer and a velocity sensor?
An accelerometer measures the rate of change in velocity and is the standard for high-frequency detection like gear mesh issues. Velocity sensors measure the actual speed of the vibration, which is often better for identifying structural looseness in a 3,600 RPM motor. Most modern industrial equipment vibration analysis relies on piezo-accelerometers because they’re durable and cover a wide frequency range from 1 Hz to 15 kHz.
How much does a professional industrial vibration analysis service cost?
Professional vibration analysis services typically cost between $1,500 and $3,000 per day depending on the number of data points. A standard plant walk-through covering 20 machines usually takes about 8 hours. You’re paying for the ISO Category III analyst’s ability to interpret complex spectra, which can save a facility $50,000 in lost production from a single avoided motor failure or shaft breakage.
What are the common ISO standards for machinery vibration?
The primary benchmark for most plants is the ISO 20816 series, which replaced the older ISO 10816 standard in 2016. These documents provide specific vibration severity charts based on machine size and foundation type. For instance, a Class I small motor has a good rating if vibrations stay under 1.1 mm/s, while larger Class IV machines allow for higher thresholds before requiring immediate maintenance.
Can vibration analysis predict how much longer a bearing will last?
Vibration analysis identifies the specific stage of bearing degradation but won’t give you a precise death date like a countdown clock. Analysts use the four stages of bearing failure to estimate remaining life. If a bearing shows Stage 3 signatures with visible sidebands around the inner race frequency, you likely have less than 15% of its service life remaining before the shaft seizes or damages the housing.
Does my equipment need to be running for an accurate vibration test?
Your machinery must be running at its normal operating temperature and load for the data to be valid. Testing a pump at 0% load won’t reveal the same hydraulic imbalances or bearing stresses found at full capacity. We generally require the equipment to reach a steady state, typically after 30 minutes of operation, to ensure the thermal expansion of the housing hasn’t skewed the alignment readings.
What is dynamic balancing, and how does it relate to vibration analysis?
Dynamic balancing is the process of adding or removing weight to a rotor to correct an uneven mass distribution, while vibration analysis is the tool used to diagnose that imbalance. If your industrial equipment vibration analysis shows a high 1x peak in the radial direction, it’s a clear indicator that the rotor is out of balance. Correcting a 50 lb fan wheel to G2.5 balance quality limits can reduce vibration levels by 90%.